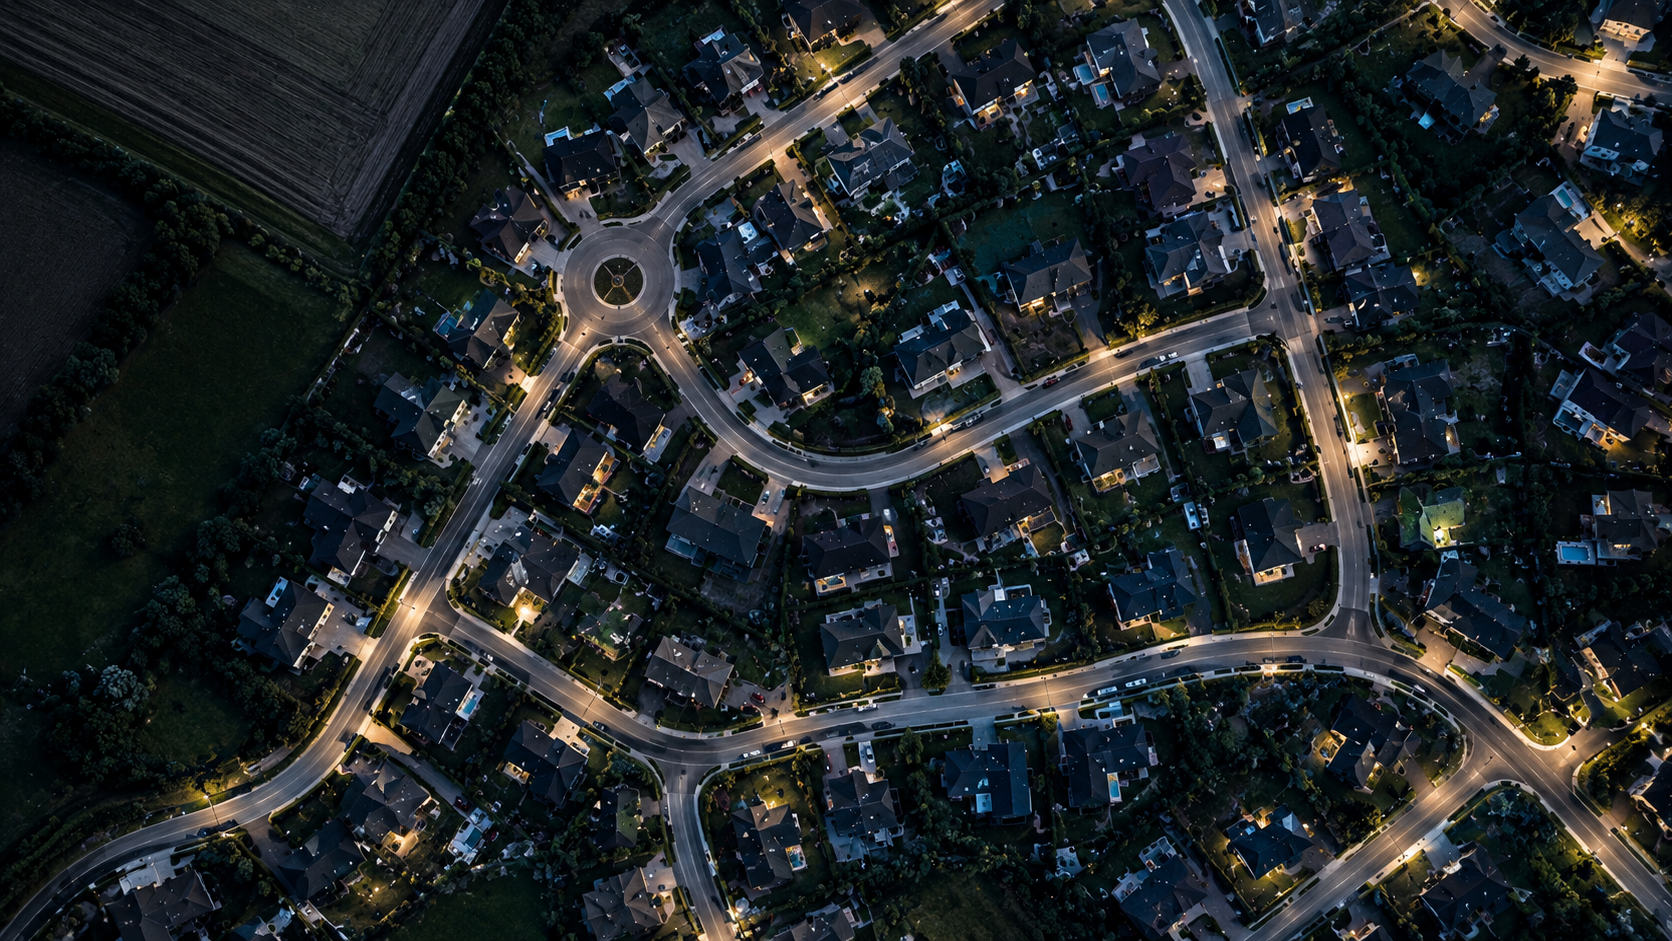
See real estate
through AI satellite data.
Type an address. Ten seconds. Everything a building hides.
Most real estate decisions are made on incomplete information. Ownership buried in holding companies. Vacancy guessed from the street. Change patterns invisible to the naked eye. rekon reads all of it — directly from orbit.
One image. Six datasets.
A single satellite pass contains more intelligence than most site visits. rekon extracts it automatically — buildings, roads, green cover, parking, height, and ownership signals — in one search.


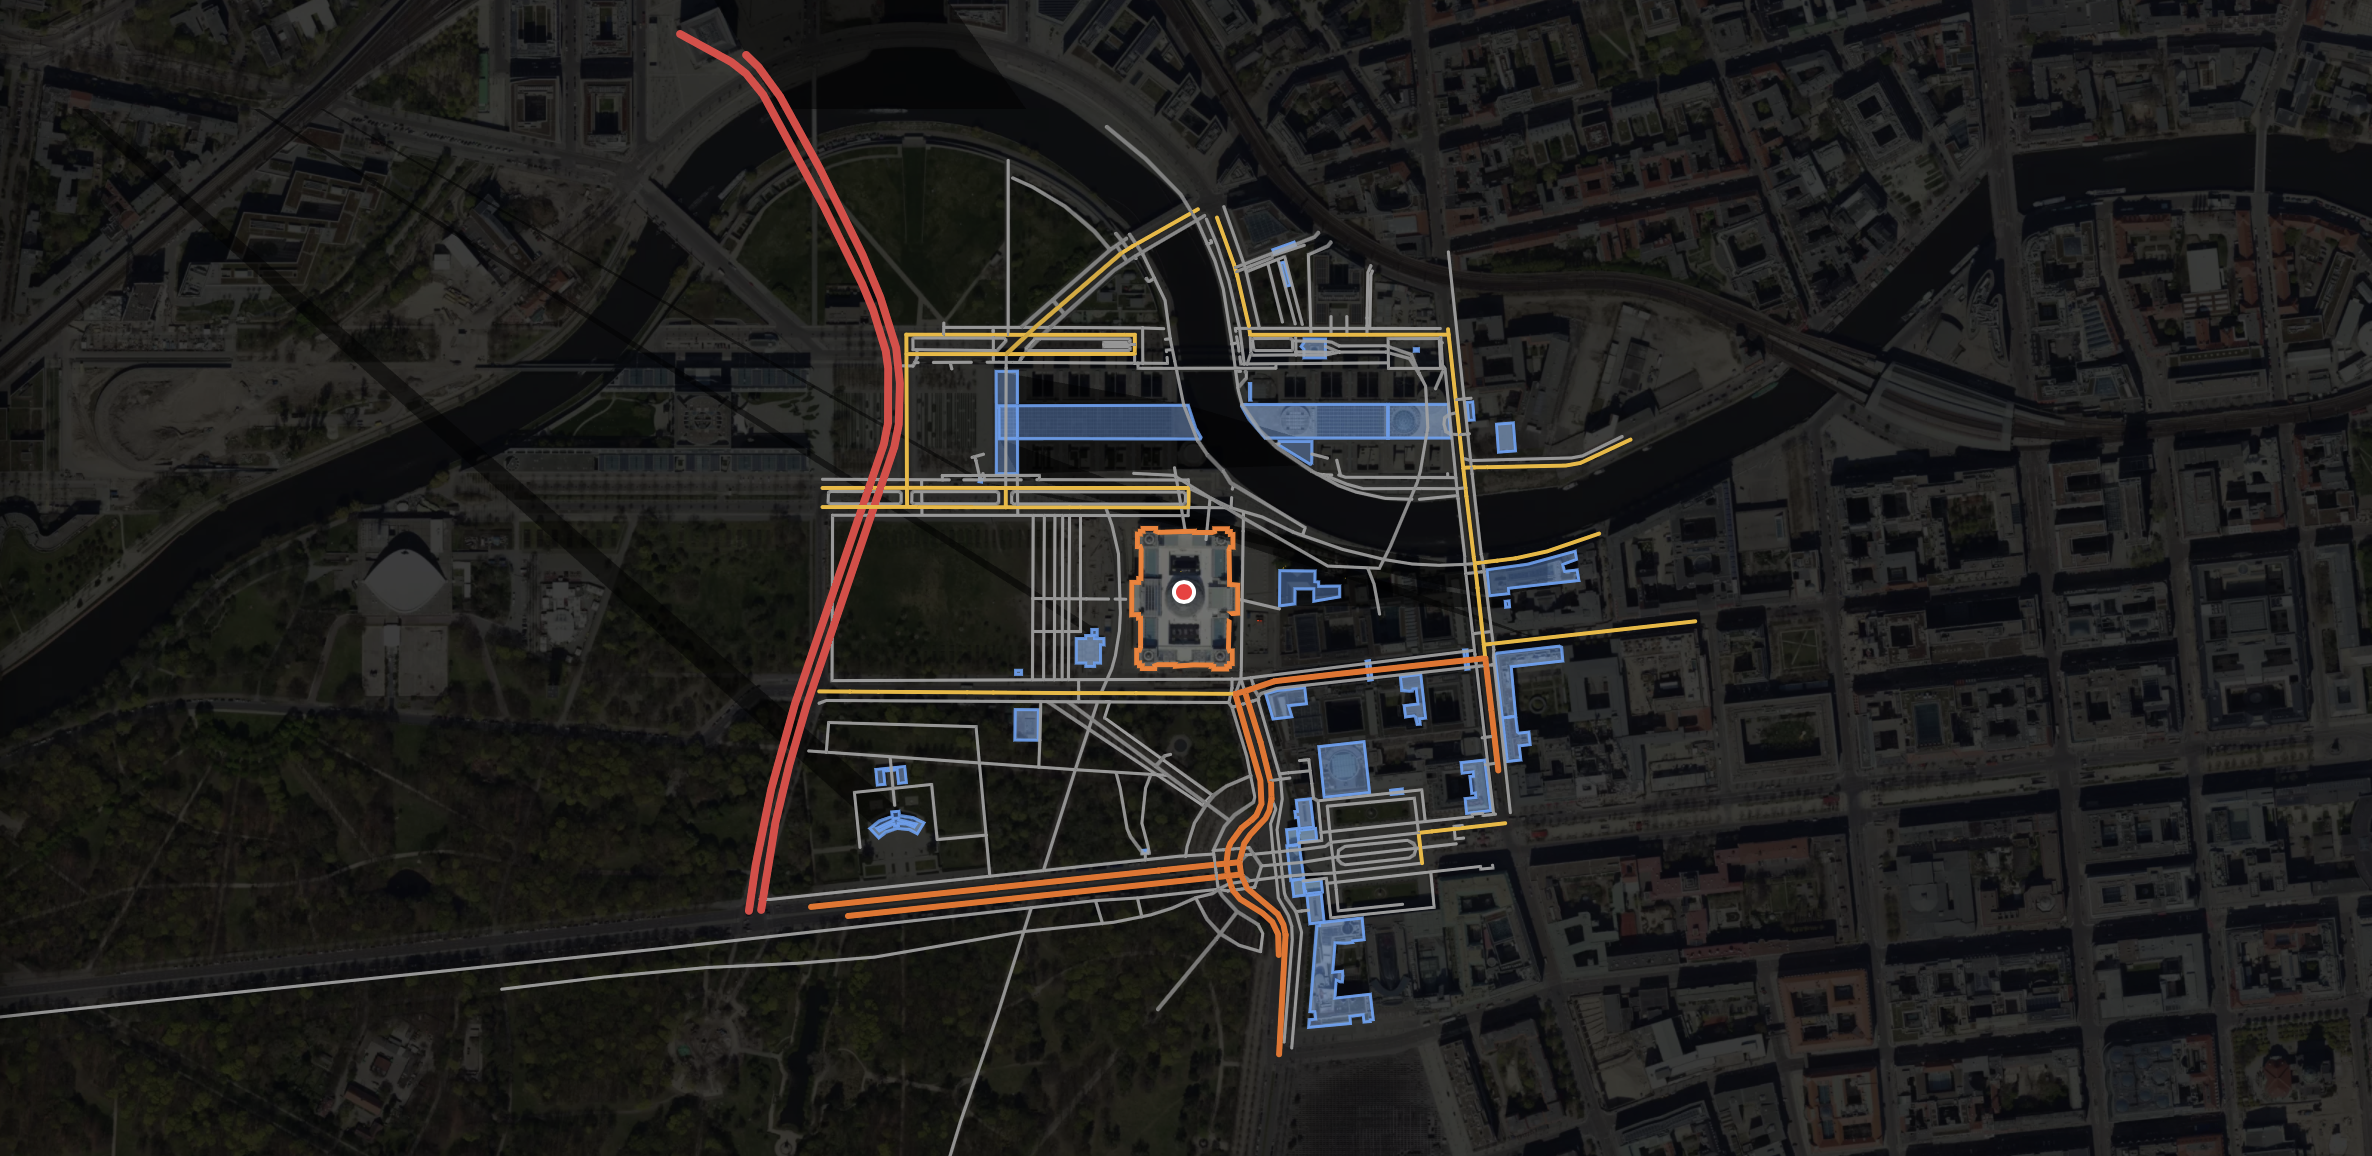


We start with the raw satellite view.
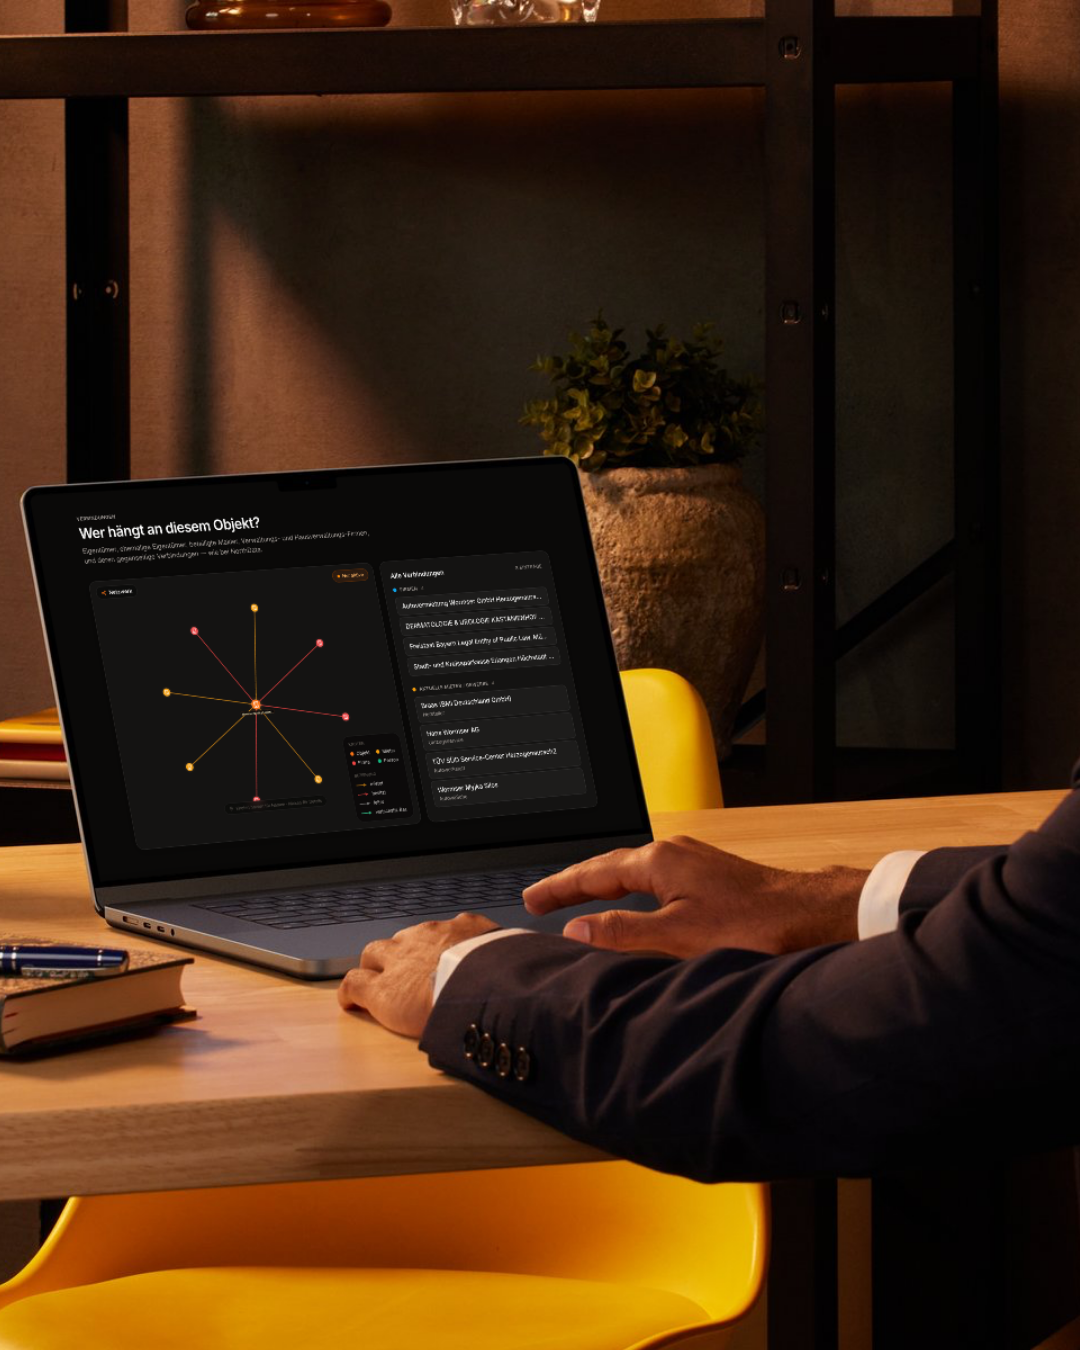
Every connection, mapped.
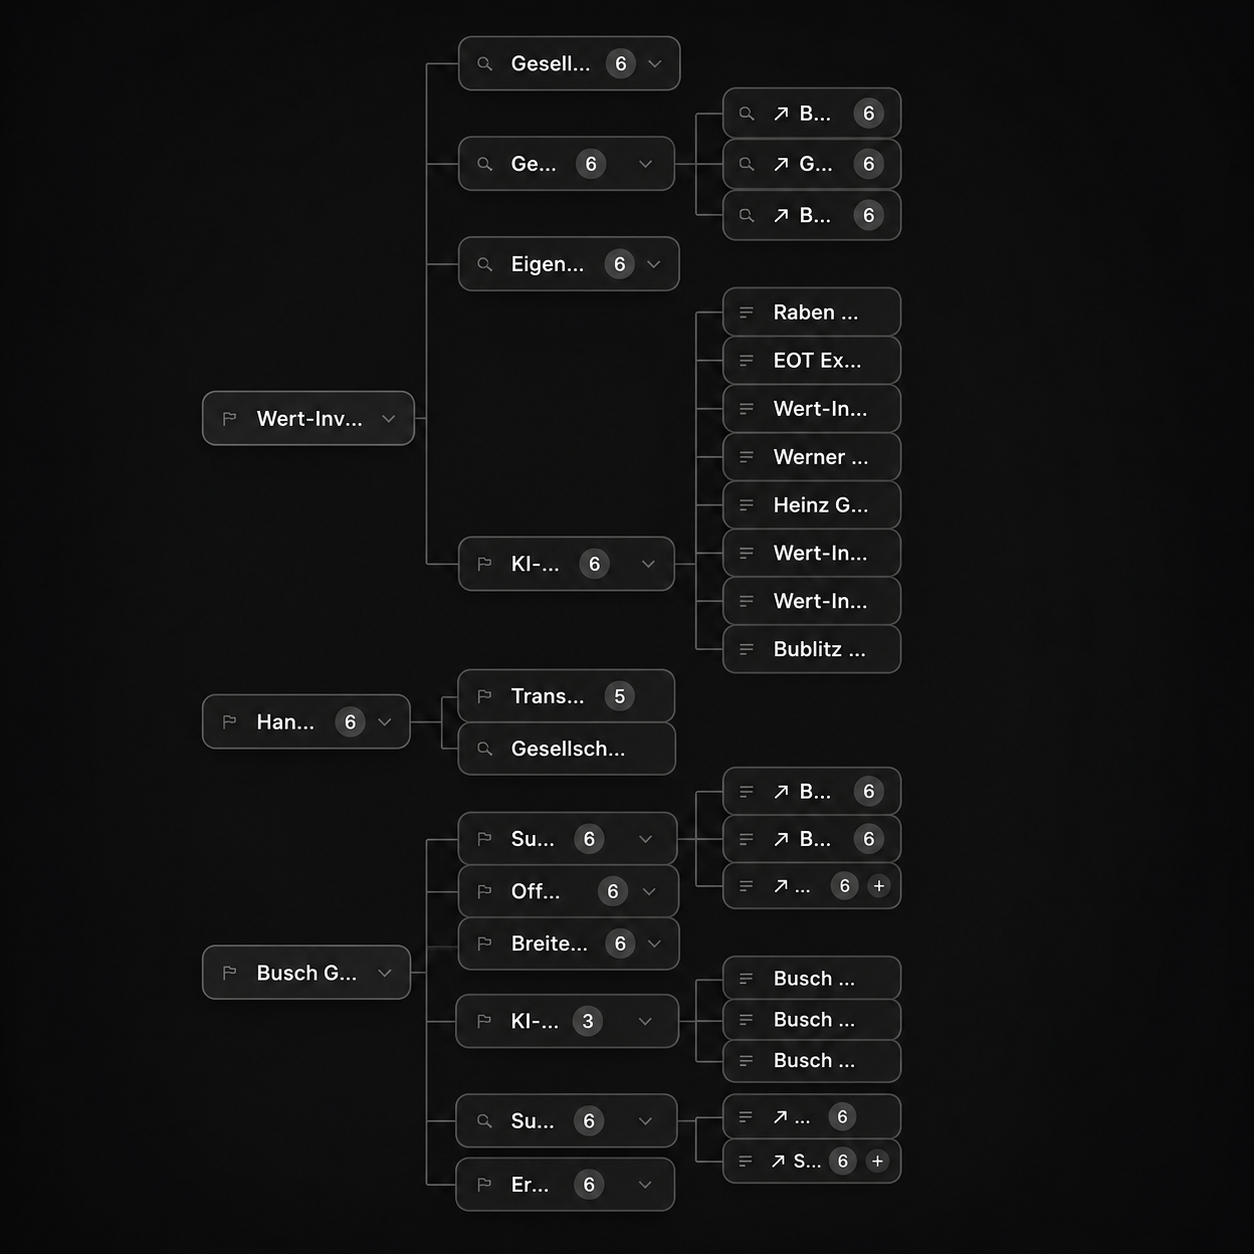
Behind every property sits a web of companies, shareholders, and individuals. rekon traces the full ownership chain — from the registered address to holding structures, co-investors, and every known tenant — and renders it as a single interactive graph. What used to take days of registry research takes seconds.
- Registered owners & holding companies
- Shareholders and co-investors
- Active tenants and commercial operators
- Planning connections and public entities


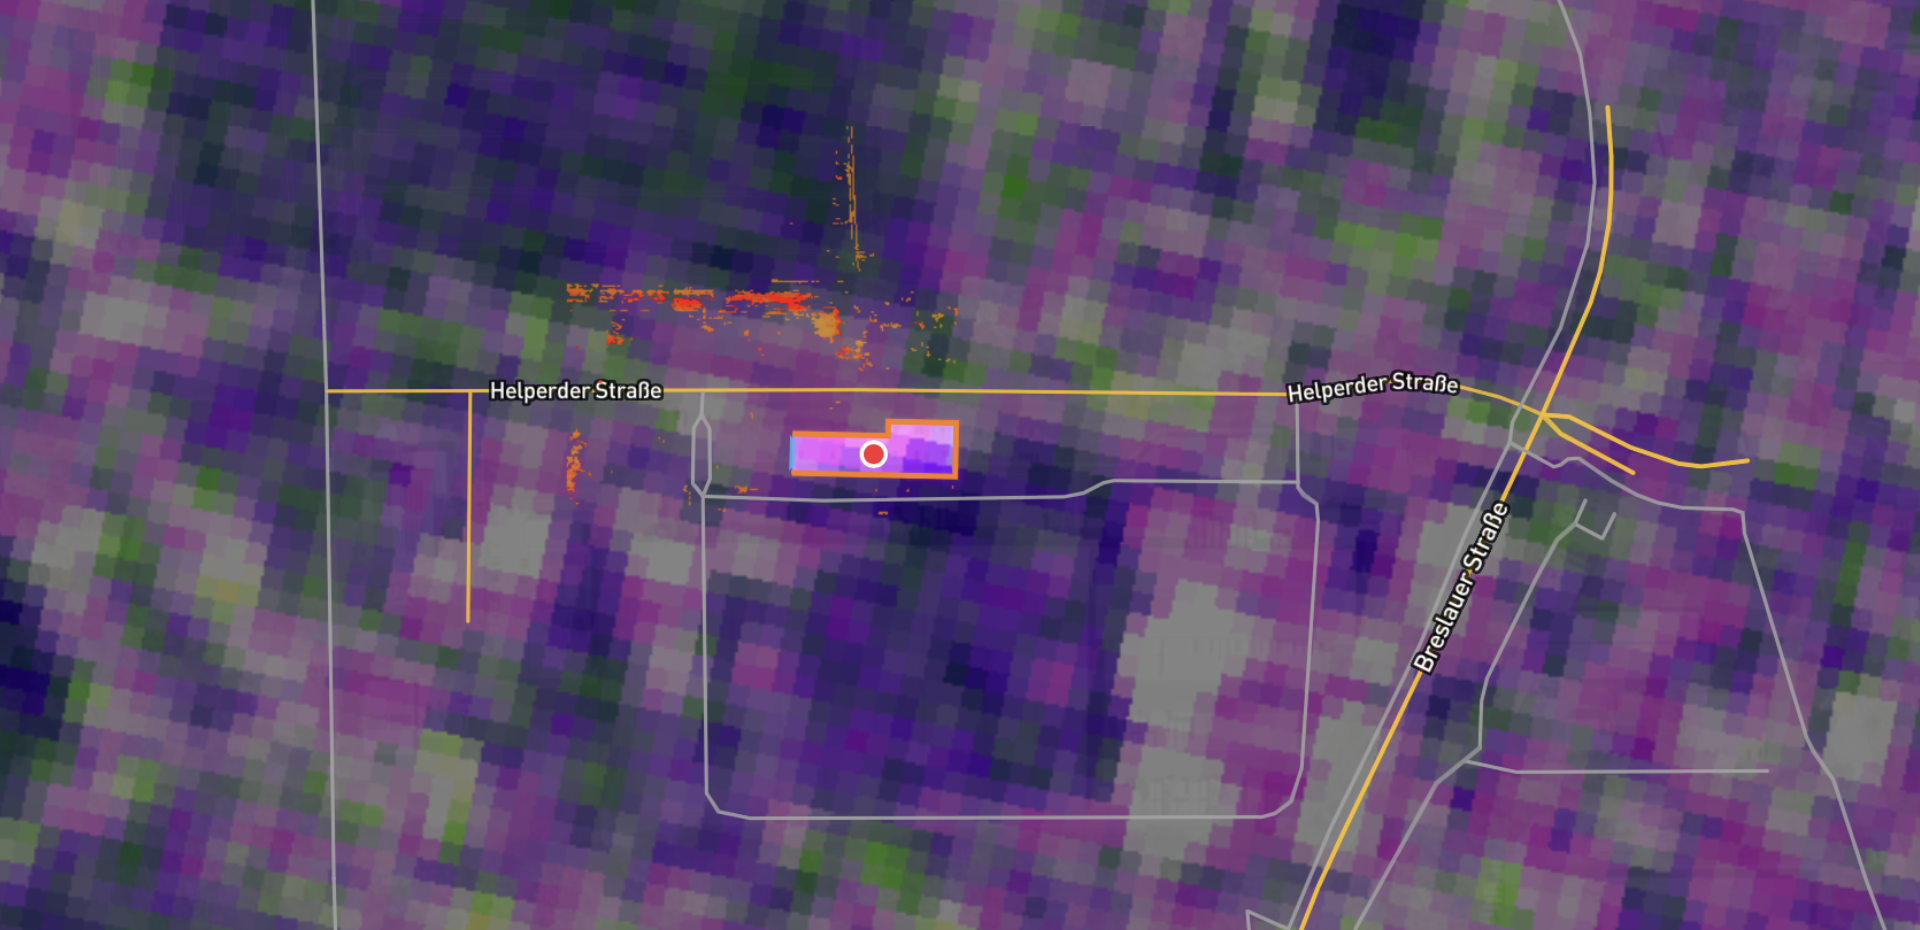
Change heatmap — every shift flagged and dated.
From data to deal flow.
A renowned commercial real estate broker in Frankfurt Rhine-Main started using rekon for ownership research and satellite change detection. In one session, they traced a complex holding structure to its source — identifying a family office as the ultimate beneficial owner of several million euros in commercial assets that had never reached the open market.
That level of intelligence didn't just inform the deal. It started a conversation. The family office recognised the quality of the research and invited the broker into their deal flow — turning a single search into a strategic partnership.
Ownership chain traced to family office.
A holding structure buried three layers deep was resolved in under ten seconds. The ultimate beneficial owner — a family office with a multi-million euro commercial portfolio — had never appeared in the broker's pipeline before.
Ownership researchOff-market assets surfaced before competitors.
Satellite change detection flagged activity on assets not listed anywhere. The broker reached out with evidence — satellite imagery, ownership data, activity timeline — rather than a cold call.
Satellite change detection · active searchA strategic partnership, not just a mandate.
The family office recognised the research quality and opened their deal flow to the broker as a trusted partner — giving ongoing access to a portfolio that had previously been entirely private.
Strategic outcomeWhat rekon surfaces.
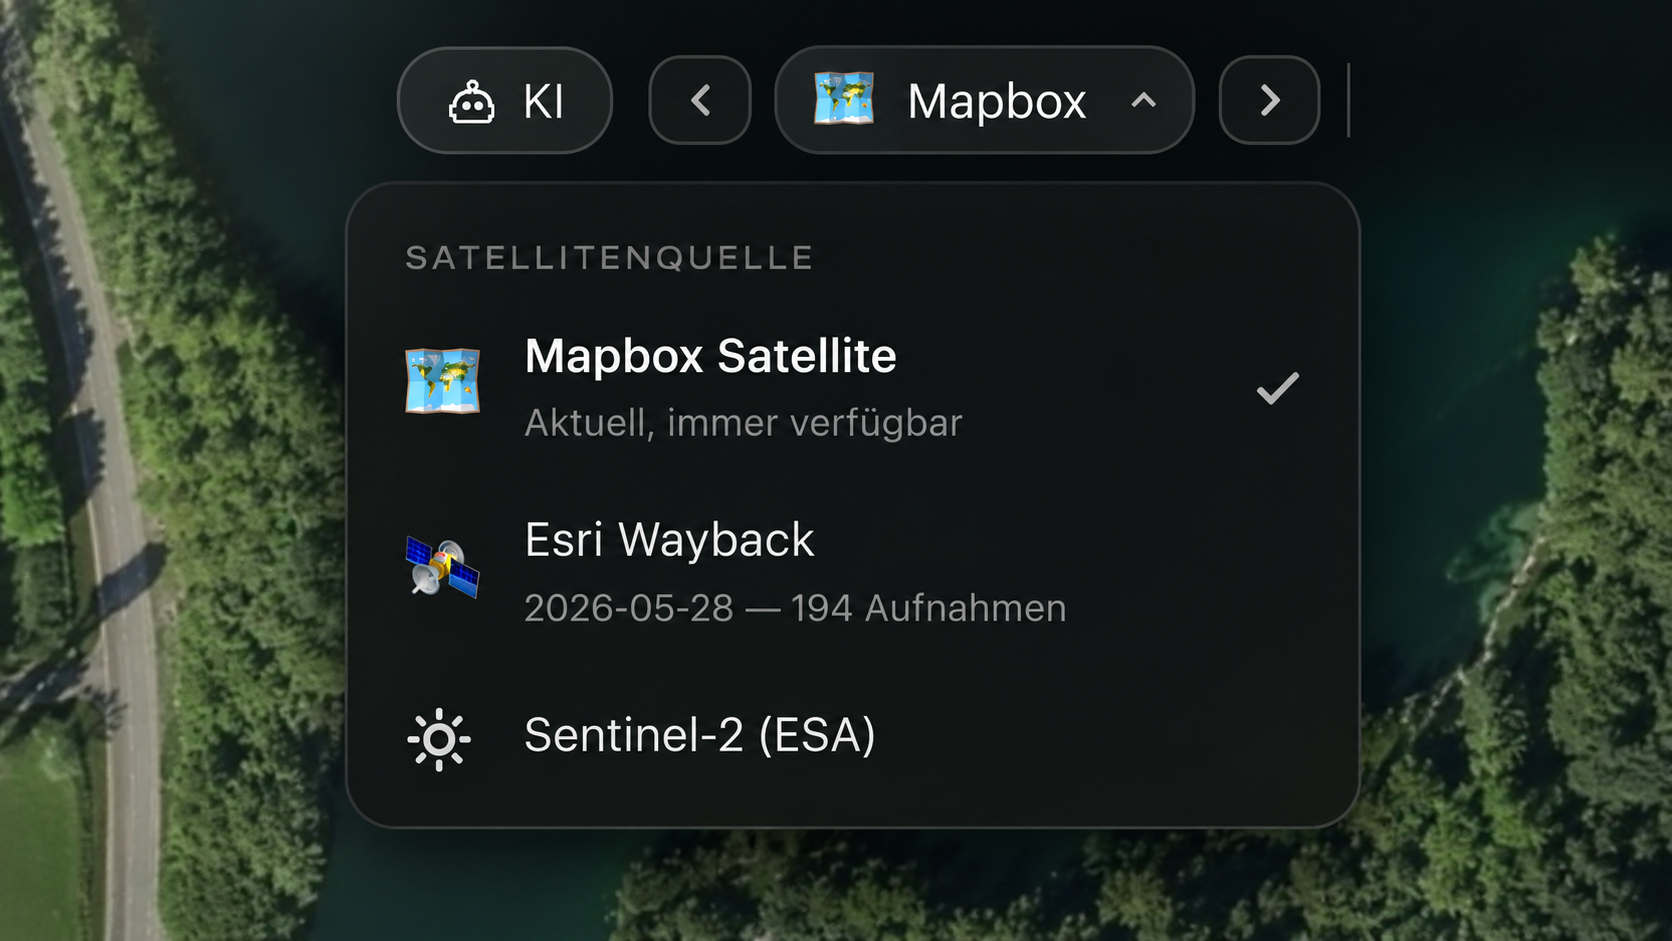 Select satellite
 Change heat map
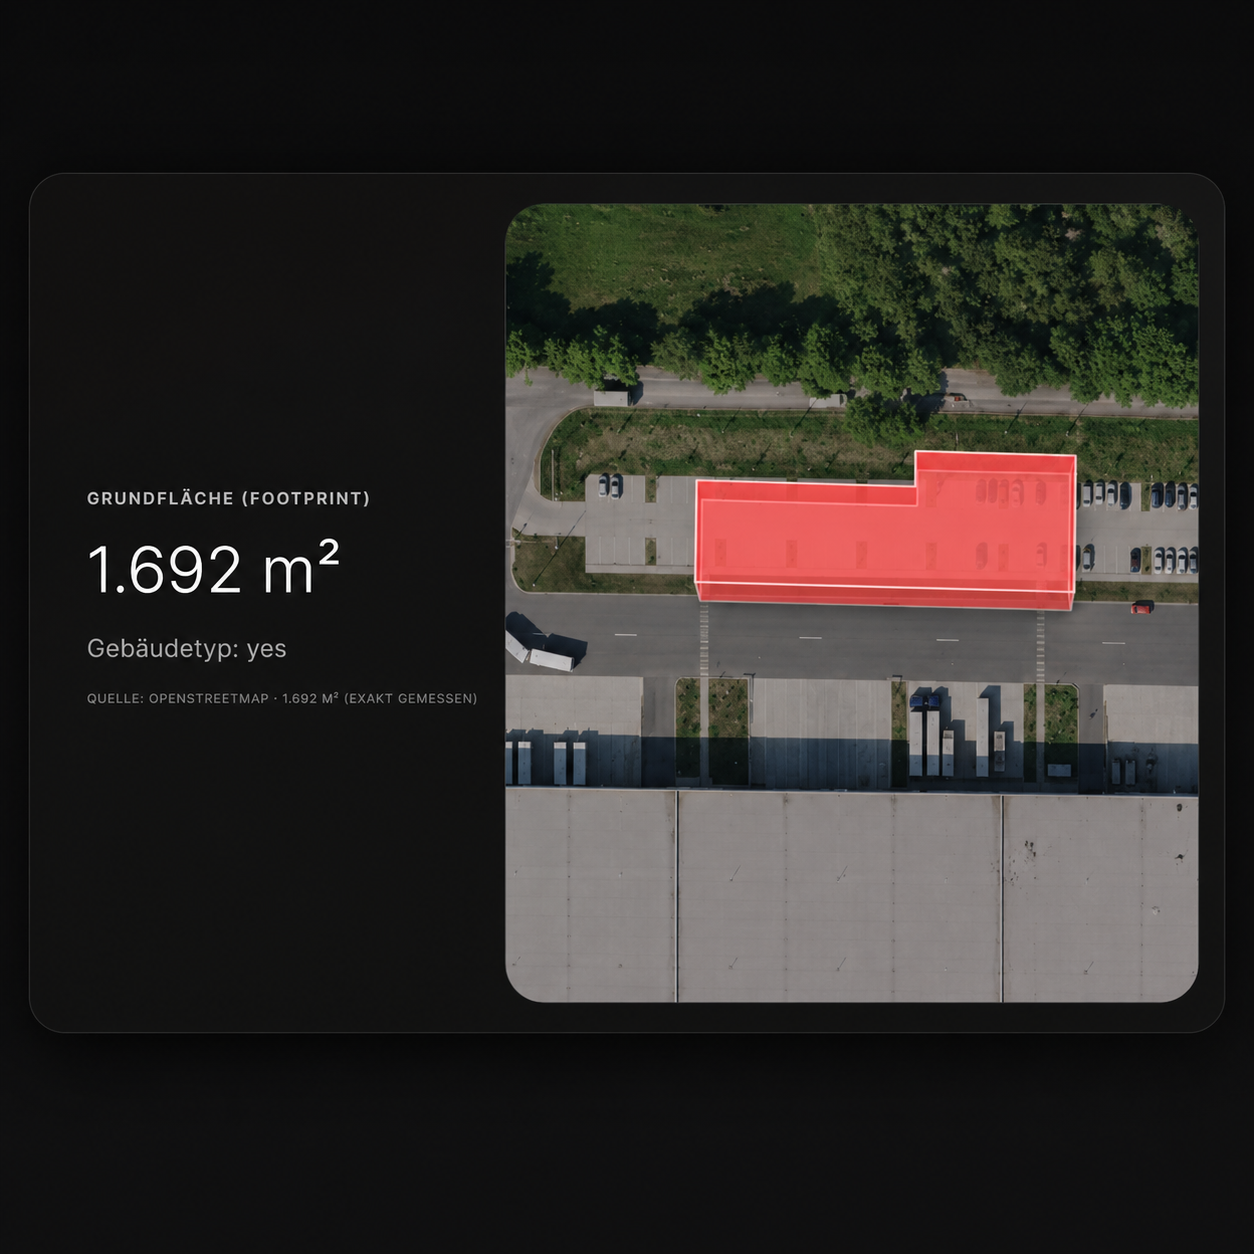 Floor plan extraction
 Height visualisation
 AI analysis
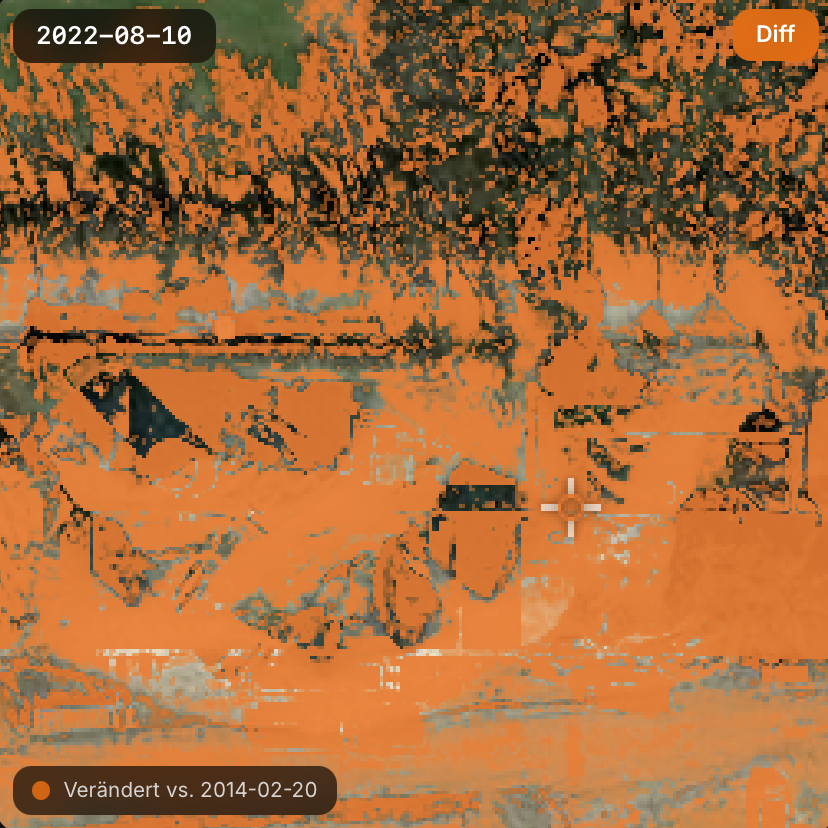 Detailed change detection
How rekon thinks.
Near-real-time satellite data.
Unlike traditional map services — where imagery can be weeks or months old — rekon pulls near-daily satellite passes. Every analysis starts from the freshest available view of the site.
Variance analysis across time.
The AI compares time-offset images automatically. Construction activity, building extensions, reinvestments, and shifts in surrounding infrastructure are flagged and dated — without a human ever opening a second tab.
Geodata measurement + pricing.
From the satellite view alone, rekon extracts perimeter, height, and gross floor area. Combined with regional comparison data, it produces an indicative price-per-square-metre — before anyone picks up the phone.
From orbit
to 3D model.
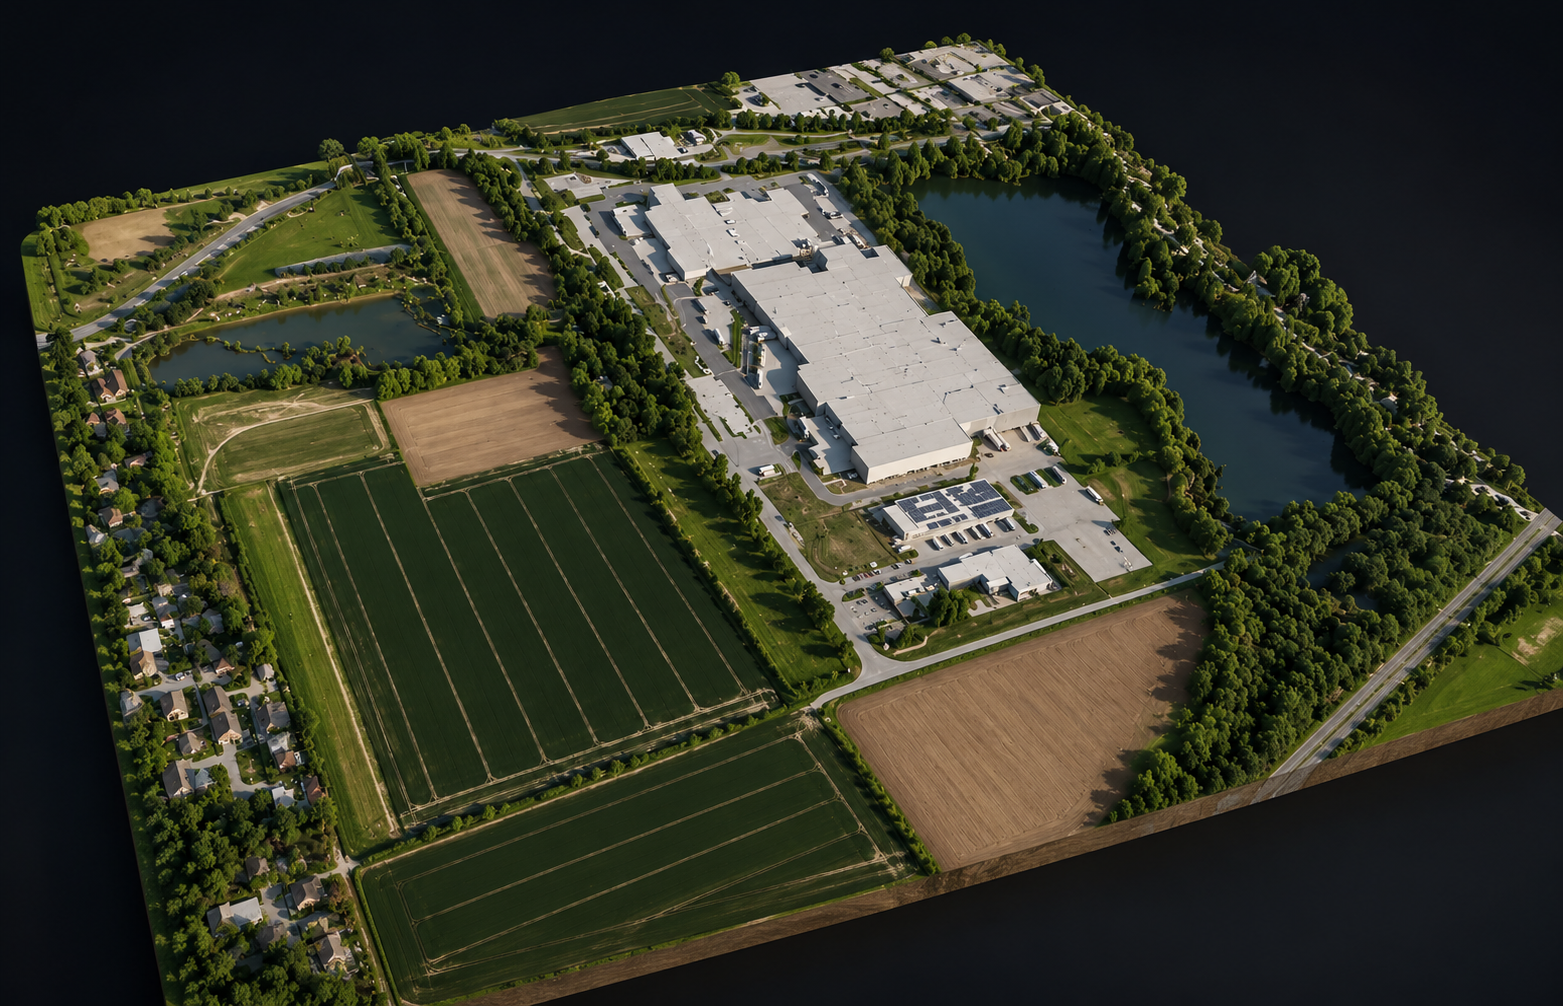
Most satellite analysis stays flat. COPERNICUS DEM changes that — it maps elevation at metre-level accuracy across the entire planet. rekon layers optical imagery directly on top of the DEM to do what no site visit can: read the terrain before setting foot on it.
Gradient, height difference, and terrain feasibility — measured automatically. Critical for construction planning and flood risk assessment.
Optical satellite imagery draped over the DEM produces a navigable 3D view of any site — no drone flight, no survey crew, no waiting.
Combine DEM with building footprints to estimate storey counts and gross floor area — extracted entirely from satellite data.
Type an address. In under ten seconds: the full ownership chain, floor-by-floor vacancy, years of change history, roof analysis, height and gross floor area, and every POI in the catchment — structured, cross-referenced, and ready to act on. No site visit. No broker call. No registry hunt.